Understanding the performance and resource consumption of your Kubernetes workloads is paramount for operational stability, cost efficiency, and effective scaling. But how does Kubernetes actually know how much CPU a specific container is using, or how much memory a Pod is consuming? This seemingly simple question hides a sophisticated interplay of components within each worker node.
This guide will peel back the layers to reveal the intricate mechanisms by which Kubelet, the primary agent on every Kubernetes node, gathers and exposes vital statistics. We’ll explore the fundamental roles of cAdvisor and the Container Runtime Interface (CRI), tracing the data flow from the Linux kernel all the way to the Kubelet’s exposed metrics endpoint.
Why Understanding Kubelet’s Metric Collection Matters
At the heart of Kubernetes’ self-healing and resource management capabilities lies its ability to observe the state and performance of its running workloads. Without accurate and timely metrics, features like Horizontal Pod Autoscaling (HPA), Vertical Pod Autoscaling (VPA), and even basic scheduling decisions would be impossible or severely suboptimal.
Understanding the internal workings of metric collection is crucial for several reasons:
- Debugging: When a container is performing poorly, knowing how Kubelet gets its data helps diagnose whether the issue is with the application, the container runtime, or the underlying host.
- Optimization: Fine-tuning resource requests and limits requires precise data. Understanding the source of that data helps interpret it correctly.
- Observability: Integrating with external monitoring systems (like Prometheus) relies on Kubelet exposing metrics in a standardized way.
- Troubleshooting: Metric collection failures can mask deeper node or runtime issues. Knowing the expected data flow aids in identifying bottlenecks or broken links in the observability chain.
The Challenge of Monitoring Containerized Workloads
Containers introduce a layer of abstraction that makes traditional host-level monitoring tools insufficient. While a host might report its total CPU usage, that doesn’t tell you which specific container is consuming the most. Containers are ephemeral, isolated, and often numerous, requiring a specialized approach to resource accounting.
The problem Kubelet was designed to solve, in part, was to provide a standardized, granular view into these isolated environments. It needs to answer questions like:
- How much CPU and memory is this specific container using?
- How much network I/O is this Pod generating?
- What are the overall resource statistics for this entire node?
The design decisions behind Kubelet’s metric collection strategy centered on efficiency, accuracy, and extensibility. It needed to leverage existing Linux kernel capabilities while remaining agnostic to the specific containerization technology.
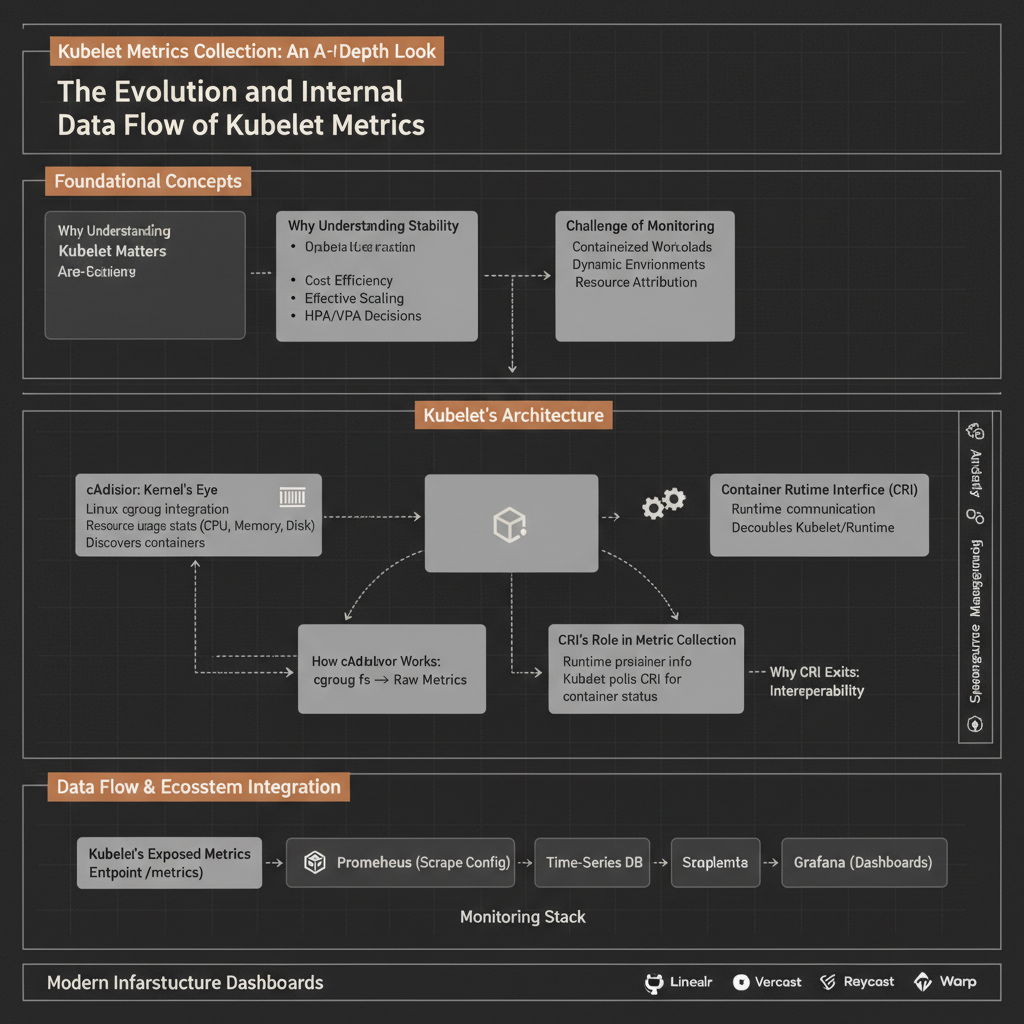
Kubelet’s Metric Collection Architecture: A High-Level View
Kubelet, running on every worker node, acts as the primary interface between the Kubernetes control plane and the node’s resources. For metrics, it orchestrates the collection of data from two main sources:
- Node-level statistics: Directly from the host operating system.
- Pod and Container-level statistics: Primarily through the Container Runtime Interface (CRI) which, in turn, often leverages
cAdvisoror similar mechanisms within the container runtime itself.
The key components involved in this process are:
- Kubelet: The agent responsible for managing Pods and exposing metrics.
- Container Runtime Interface (CRI): A gRPC API that allows Kubelet to communicate with various container runtimes (e.g., containerd, CRI-O).
- Container Runtime: The software responsible for running containers (e.g., containerd, which itself might integrate cAdvisor or similar logic).
- cAdvisor (Container Advisor): An open-source agent that discovers and collects performance metrics from running containers by interfacing with the Linux kernel’s
cgroupsubsystem. - Linux Kernel (cgroups): The fundamental kernel feature that isolates and accounts for resource usage for groups of processes, which is what containers are built upon.
Here’s a simplified view of the overall flow:
cAdvisor: The Linux Kernel’s Eye on Containers
cAdvisor (Container Advisor) is an open-source tool originally developed by Google. Its primary purpose is to provide resource usage and performance characteristics of running containers.
How cAdvisor Works at a Fundamental Level
At its core, cAdvisor acts as a bridge between the container world and the Linux kernel’s cgroup (control groups) subsystem.
- cgroups: The Linux kernel’s
cgroupfeature is a powerful mechanism for organizing processes into hierarchical groups and allocating system resources (CPU, memory, network I/O, block I/O) to them. When a container is launched, the container runtime places its processes into specific cgroups. - Direct Interface: cAdvisor directly interfaces with the
cgroupfilesystem (typically mounted at/sys/fs/cgroup). It reads various files within the cgroup hierarchy to gather precise, kernel-level resource utilization data.- For CPU usage, it reads files like
cpuacct.usageorcpu.stat. - For memory usage, it reads
memory.usage_in_bytesandmemory.stat. - For filesystem I/O, it reads
blkio.io_service_bytes_recursive. - For network usage, it typically relies on parsing
/proc/net/devor similar kernel interfaces, associating network interfaces with container network namespaces.
- For CPU usage, it reads files like
cAdvisor’s Role in Kubernetes
Historically, cAdvisor was a standalone component that Kubelet directly queried for container metrics. In many modern Kubernetes deployments, cAdvisor’s functionality is often integrated directly into the container runtime itself (e.g., containerd has its own cgroup monitoring logic that effectively performs the same function). This integration streamlines the data flow and reduces overhead.
Regardless of whether it’s a separate process or integrated, the fundamental mechanism remains the same: a component directly reads the kernel’s cgroup information to get raw container resource data.
Container Runtime Interface (CRI): Standardizing Container Operations
The Container Runtime Interface (CRI) is a plugin interface that Kubelet uses to interact with different container runtimes. It defines a gRPC API for Kubelet to perform all container-related operations, including lifecycle management (creating, starting, stopping containers) and, crucially, metric collection.
Why CRI Exists
Before CRI, Kubelet had direct integrations with specific runtimes like Docker. This led to tight coupling and made it difficult to swap out container runtimes. CRI was introduced to:
- Decouple Kubelet: Allow Kubelet to communicate with any CRI-compliant container runtime.
- Promote Innovation: Enable new container runtimes to emerge and integrate easily with Kubernetes.
- Standardize Operations: Provide a consistent API for managing containers and pods.
CRI’s Role in Metric Collection
With the introduction of the PodAndContainerStatsFromCRI feature gate (which is now generally enabled by default), Kubelet shifted its primary method for gathering pod and container metrics. Instead of directly querying a local cAdvisor instance, Kubelet now polls the underlying container runtime via CRI.
This means the container runtime is responsible for:
- Collecting the raw metrics (either by integrating cAdvisor-like logic or directly interfacing with cgroups).
- Aggregating them (e.g., summing container stats to get pod stats).
- Returning them to Kubelet via the CRI
RuntimeService.ListPodSandboxStatsandRuntimeService.ContainerStatsgRPC calls.
The Evolution and Internal Data Flow of Kubelet Metrics
The path metrics take to reach Kubelet has evolved, primarily driven by the adoption of CRI.
The “Old” Way (Pre-CRI Stats)
In earlier versions of Kubernetes, the data flow was simpler:
- Kubelet would directly query the cAdvisor instance running on the same node.
- cAdvisor would read resource usage data directly from the Linux kernel’s cgroup subsystem.
- cAdvisor would then expose this data to Kubelet (and potentially other monitoring agents).
- Kubelet would aggregate container stats into pod stats and expose everything via its
/metricsendpoint.
This approach worked but meant Kubelet had a direct dependency on cAdvisor and its output format.
The “New” Way (With CRI Stats Enabled)
With PodAndContainerStatsFromCRI enabled (which is the standard configuration today), the container runtime becomes the central point for container-level metric collection.
Here’s a step-by-step breakdown of what happens under the hood:
- Kubelet Polls: Periodically (e.g., every 10 seconds), Kubelet initiates a request to the container runtime to gather stats for all active pods and containers.
- CRI gRPC Call: Kubelet makes a gRPC call to the container runtime via the CRI
RuntimeService. The primary calls areListPodSandboxStats(to get overall pod stats, which includes aggregated container stats) and potentiallyContainerStatsfor individual container details. - Container Runtime’s Internal Logic:
- The container runtime (e.g.,
containerdorCRI-O) receives the request. - It then uses its own internal mechanisms to collect resource usage. This might involve:
- Integrated cgroup reader: Many runtimes have built-in logic that directly reads from the
/sys/fs/cgroupfilesystem, similar to how cAdvisor operates. - Embedded cAdvisor: Some runtimes might embed a lightweight version of cAdvisor or integrate its libraries.
- Integrated cgroup reader: Many runtimes have built-in logic that directly reads from the
- The runtime iterates through the cgroups associated with each running container and pod sandbox (which is also a cgroup).
- It reads raw kernel statistics for CPU, memory, block I/O, and network usage.
- It aggregates container-level stats to produce pod-level stats where necessary.
- The container runtime (e.g.,
- Data Return via CRI: The container runtime packages these collected and aggregated statistics into the CRI
PodSandboxStatsandContainerStatsprotobuf messages. - Kubelet Processes Data: Kubelet receives these structured metrics from the container runtime. It then combines them with node-level metrics (which it collects directly from the host system, e.g.,
/proc/meminfo,/proc/stat) and its own internal operational metrics. - Metrics Exposure: Finally, Kubelet exposes all this aggregated data in Prometheus format via its HTTP
/metricsendpoint, typically on port10250or10255.
📌 Key Idea: The container runtime has become the authoritative source for container and pod resource metrics, abstracting the underlying cgroup interaction from Kubelet via CRI.
Exposing Metrics: Kubelet’s /metrics Endpoint
Once Kubelet has collected all the necessary statistics, it makes them available through an HTTP endpoint, typically /metrics. This endpoint serves metrics in the Prometheus text exposition format, making it easy for Prometheus or other monitoring systems to scrape and store this data.
The types of metrics exposed include:
- Node-level metrics: CPU, memory, network I/O, disk usage of the host machine itself. Example:
node_cpu_seconds_total,node_memory_MemTotal_bytes. - Kubelet operational metrics: Metrics about Kubelet’s own performance, like API call latencies, number of running pods, etc. Example:
kubelet_running_pods_count,kubelet_runtime_operations_total. - Pod-level metrics: Aggregated resource usage for an entire Pod. Example:
pod_cpu_usage_seconds_total,pod_memory_working_set_bytes. - Container-level metrics: Granular resource usage for individual containers. Example:
container_cpu_usage_seconds_total,container_memory_working_set_bytes.
⚡ Real-world insight: Monitoring solutions like Prometheus typically discover Kubelet’s /metrics endpoint through Kubernetes service discovery and then periodically scrape it to collect time-series data.
A Mini-Project: Accessing Kubelet Metrics Directly
You can directly access the Kubelet’s /metrics endpoint to see the raw data it exposes. This is a powerful way to debug and understand what your monitoring system is seeing.
Prerequisites:
- A running Kubernetes cluster.
kubectlconfigured to connect to your cluster.
Steps:
Identify a Kubelet port: Kubelet typically exposes its secure
/metricsendpoint on port10250or10255(depending on configuration and security settings). You can find the Kubelet’s address and port by inspecting a node’s status or Kubelet configuration. For simplicity, we’ll assume it’s10255and use a proxy.Port-forward to a Kubelet: Pick any worker node in your cluster. We’ll port-forward to its Kubelet API.
    # Replace <your-node-name> with the actual name of one of your worker nodes
    NODE_NAME="your-worker-node-name"
    kubectl port-forward "$NODE_NAME" 10255:10255 --address 0.0.0.0 &
This command will forward local port `10255` to the Kubelet's `10255` port on the specified node. The `&` runs it in the background.
- Curl the metrics endpoint: Open another terminal and use
curlto fetch the metrics.
curl http://localhost:10255/metrics
You will see a large output of Prometheus-formatted metrics. Here's a small snippet of what you might observe:
    # HELP container_cpu_usage_seconds_total Cumulative cpu time consumed by the container in core-seconds.
    # TYPE container_cpu_usage_seconds_total counter
    container_cpu_usage_seconds_total{container="kube-proxy",id="/kubepods/burstable/podxxxx/containerxxxx",image="registry.k8s.io/kube-proxy:v1.28.3",name="k8s_kube-proxy_kube-proxy-xxx",namespace="kube-system",pod="kube-proxy-xxx"} 48.749552145
    container_cpu_usage_seconds_total{container="coredns",id="/kubepods/burstable/podyyyy/containeryyyy",image="registry.k8s.io/coredns/coredns:v1.10.1",name="k8s_coredns_coredns-yyyy",namespace="kube-system",pod="coredns-yyyy"} 12.345678901
    # HELP container_memory_working_set_bytes Current working set of the container in bytes.
    # TYPE container_memory_working_set_bytes gauge
    container_memory_working_set_bytes{container="kube-proxy",id="/kubepods/burstable/podxxxx/containerxxxx",image="registry.k8s.io/kube-proxy:v1.28.3",name="k8s_kube-proxy_kube-proxy-xxx",namespace="kube-system",pod="kube-proxy-xxx"} 20480000
    container_memory_working_set_bytes{container="coredns",id="/kubepods/burstable/podyyyy/containeryyyy",image="registry.k8s.io/coredns/coredns:v1.10.1",name="k8s_coredns_coredns-yyyy",namespace="kube-system",pod="coredns-yyyy"} 5120000
    # HELP kubelet_node_name Name of the node.
    # TYPE kubelet_node_name gauge
    kubelet_node_name{node_name="your-worker-node-name"} 1
Remember to kill the `kubectl port-forward` process when you're done.
Performance Characteristics, Trade-offs, and Optimization Techniques
The metric collection process in Kubernetes is designed to be lightweight but still introduces some overhead.
- Lightweight cgroups: Reading from the
cgroupfilesystem is highly efficient as it’s a kernel-level mechanism with minimal overhead. - Polling Interval: Kubelet polls the container runtime periodically (e.g., every 10 seconds). This interval is a trade-off between freshness of data and system load. More frequent polling provides finer-grained metrics but increases CPU and I/O usage on the node.
- CRI Abstraction Overhead: While CRI provides flexibility, the gRPC calls and serialization/deserialization of data introduce a small amount of overhead compared to direct memory access or highly optimized in-process calls. However, this is generally negligible given the benefits of abstraction.
- Container Runtime Efficiency: The efficiency of metric collection heavily depends on the container runtime’s internal implementation. A runtime that efficiently reads cgroups and aggregates data will perform better.
- Metric Cardinality: The number of metrics exposed can grow significantly with the number of pods and containers. High cardinality (many unique label combinations) can increase the size of the
/metricsendpoint response and the load on monitoring systems.
🔥 Optimization / Pro tip: For very large clusters or nodes with many pods, consider adjusting the Kubelet’s --housekeeping-interval flag (which affects metric collection frequency) if you observe performance issues, though this is rarely needed for typical workloads. Also, ensure your monitoring system is optimized to handle the volume of metrics.
Common Misconceptions and What Actually Happens
Misconception: cAdvisor is always a separate, independent process that Kubelet talks to. Reality: While cAdvisor can run as a standalone container, its core functionality (reading cgroups) is often integrated directly into the container runtime (like containerd) or leveraged by it. Kubelet primarily interacts with the container runtime via CRI for metrics, not directly with a separate cAdvisor daemon in modern Kubernetes versions.
Misconception: Kubelet directly reads
/sys/fs/cgroupfor container stats. Reality: Kubelet delegates this responsibility to the container runtime via CRI. The container runtime is the one that directly interfaces with the Linux kernel’s cgroup subsystem. Kubelet receives processed and aggregated data from the runtime.Misconception: Kubelet metrics are only for Prometheus. Reality: While the Prometheus exposition format is widely adopted, Kubelet’s
/metricsendpoint is a standard HTTP endpoint that any tool capable of parsing that format can consume.
Failure Modes: What Breaks, When, and Why
Understanding potential failure points is key for robust operations.
- Container Runtime Unresponsiveness: If the container runtime (e.g., containerd) becomes unresponsive or crashes, Kubelet will fail to get metrics via CRI. This will lead to stale or missing container/pod metrics in
/metrics.- Why: The CRI gRPC calls from Kubelet will time out or fail.
- Linux Kernel cgroup Issues: Problems with the underlying Linux kernel’s cgroup subsystem (e.g., filesystem corruption, kernel bugs) can prevent the container runtime (or cAdvisor) from correctly reading resource usage.
- Why: The
/sys/fs/cgroupfiles might be unreadable or return incorrect data.
- Why: The
- Kubelet Overload: If the node is heavily loaded, Kubelet itself might struggle to process all its tasks, including metric collection and exposure. This can lead to delays in metric updates or even the
/metricsendpoint becoming slow to respond.- Why: Kubelet is a single process, and resource contention on the node can impact its performance.
- Network Issues to Kubelet’s
/metrics: External monitoring systems might fail to scrape Kubelet’s/metricsendpoint due to network connectivity problems, firewall rules, or certificate issues (if using HTTPS).- Why: Standard networking failures prevent HTTP requests from reaching Kubelet.
- High Metric Cardinality: While not a “breakdown,” an excessive number of unique metric labels (e.g., dynamically generated pod names, ephemeral containers) can lead to a very large
/metricsresponse, causing high CPU/memory usage for Kubelet and the monitoring system.- Why: More data points and labels mean more processing and storage.
Key Engineering Insights
The evolution of Kubernetes metric collection highlights several critical engineering principles:
- Abstraction is Power: The introduction of CRI effectively abstracted away the specifics of container runtimes, allowing Kubernetes to remain flexible and vendor-neutral while still getting crucial data. This decoupling is a cornerstone of robust system design.
- Leverage Kernel Primitives: Relying on fundamental Linux kernel features like
cgroupsensures highly accurate, efficient, and low-overhead resource accounting, rather than requiring complex application instrumentation. - Observability as a First-Class Citizen: Kubernetes was designed from the ground up with observability in mind. The standardized
/metricsendpoint, combined with the clear data flow, makes it relatively straightforward to integrate with various monitoring solutions. - Continuous Improvement: The shift from direct cAdvisor interaction to CRI-based metric collection demonstrates Kubernetes’ commitment to refining its architecture for better performance, maintainability, and extensibility over time. This iterative development ensures the platform remains relevant and efficient as underlying technologies evolve.
Understanding these internals not only demystifies how Kubernetes works but also empowers you to build, operate, and troubleshoot containerized applications more effectively.
References
- Kubernetes Docs: CRI Pod & Container Metrics
- What is a cAdvisor (Container Advisor)? - Virtana
- Kubelet Metrics: How cAdvisor and CRI Collect Kubernetes Stats - itnext.io
- Kubelet & cAdvisor - Monitoring & Observability for Kubernetes - thomasriley.co.uk
Transparency Note
The information provided in this article is based on publicly available documentation for Kubernetes, cAdvisor, and the Container Runtime Interface (CRI) as of early 2026. Kubernetes is an open-source project that undergoes continuous development, and specific implementation details or default behaviors may evolve in future releases. The mini-project assumes a standard Kubernetes setup and kubectl configuration.